We realize projects for you around the topic of web cartography. We emphasize on individually tailored solutions for our customers. Our services range from pure geodata processing and the development of interactive map applications to graphic map design. Below you will find a few examples of services that are intended to serve as inspiration and reflect our experience. Are you looking for a new solution for your map presentation on the web or do you have questions about one of our projects? Contact us simply and without any obligation.
Map creation
A special focus of our work is the creation of public transport maps based on OpenStreetMap data. Users as well as public transport operators all over the world enjoy using our public transport map. In this map the public transport data from OpenStreetMap is displayed with worldwide coverage and continuously updated:
Public transport means are recorded in OpenStreetMap as relatively complex data objects. Many data processing tools in the OpenStreetMap environment can therefore not completely process the data or convert it to a form that can easily be displayed on a map. Here we have built up a lot of experience and our own tools to automatically prepare the data for map display. An example of this is the aggregation of line numbers along specific routes, so that the means of transport that run on a road are not drawn one above the other. Otherwise, not all means of transport on the same route can be displayed.
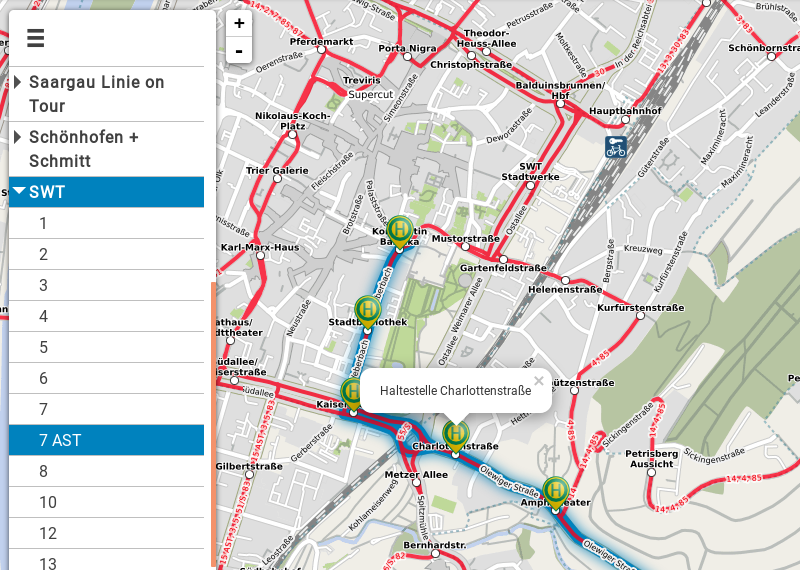
Another technique that is often used in public transport maps is the parallel display of several lines on a road, each slightly shifted from the actual route, so that each line can have its own color and can easily be tracked across the entire map. Here, too, we have developed tools that allow the creation of such a representation with data from OpenStreetMap. Here is an example of the Cologne/Bonn light rail network:
Data processing
Data preprocessing is often required for map creation in order to optimize the source data for map display. Here we have extensive knowledge of how to convert OpenStreetMap data into meaningful shapefiles or PostGIS databases. In contrast to many well-known tools from the OpenStreetMap environment, we can preserve and handle information related to public transport.

In order to use the very detailed information from OpenStreetMap on large overview maps, it is often necessary to generalize the data. The amount of data is reduced by omitting unimportant details and simplifying geometries, which on one hand considerably accelerates the processing speed in subsequent processes and on the other hand significantly improves the readability of the maps generated from it. Here, too, we have built up tools over the years in order to be able to perform such generalizations over the entire OpenStreetMap dataset within a reasonable amount of time.
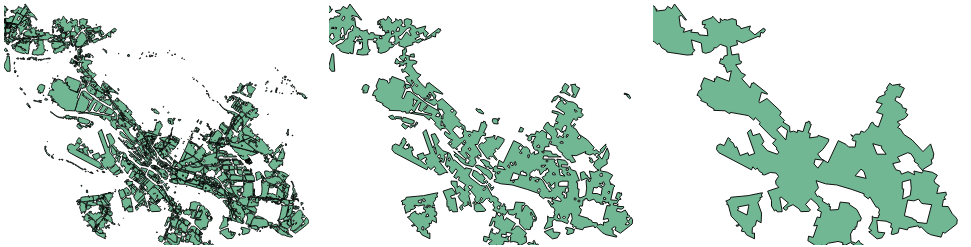
The following example shows the generalization of the settlement areas of Bremen. Starting from the original data on the left, the data was simplified step by step. In the first step the data was reduced to about 4.4%, in the second step even to 1.3% (98.7% reduction).
Interactive maps
The advantages of digital cartography become particularly noticeable for the user through interactivity. This means that considerably more information can be presented to the user than on a conventional map and important additional information can be displayed depending on the context. In addition, reading the map can be made easier for the user by highlighting specific elements. In order to realize such interactive maps we gladly take over the necessary software development. In the Frontend we have a lot of experience with Leaflet and Openlayers. In addition, we are happy to implement backend APIs if required.